Notes on adding OpenTelemetry to an Elixir app
Mar 17, 2024
I’ve been working on a FIT file viewer using LiveView. This tool takes a FIT file, processes it, and displays its contents along with some additional data. I don’t care about the data in the file itself, but I wanted to know, when it’s deployed, how long it takes to parse files and how often it fails. The tool has very simple UI:
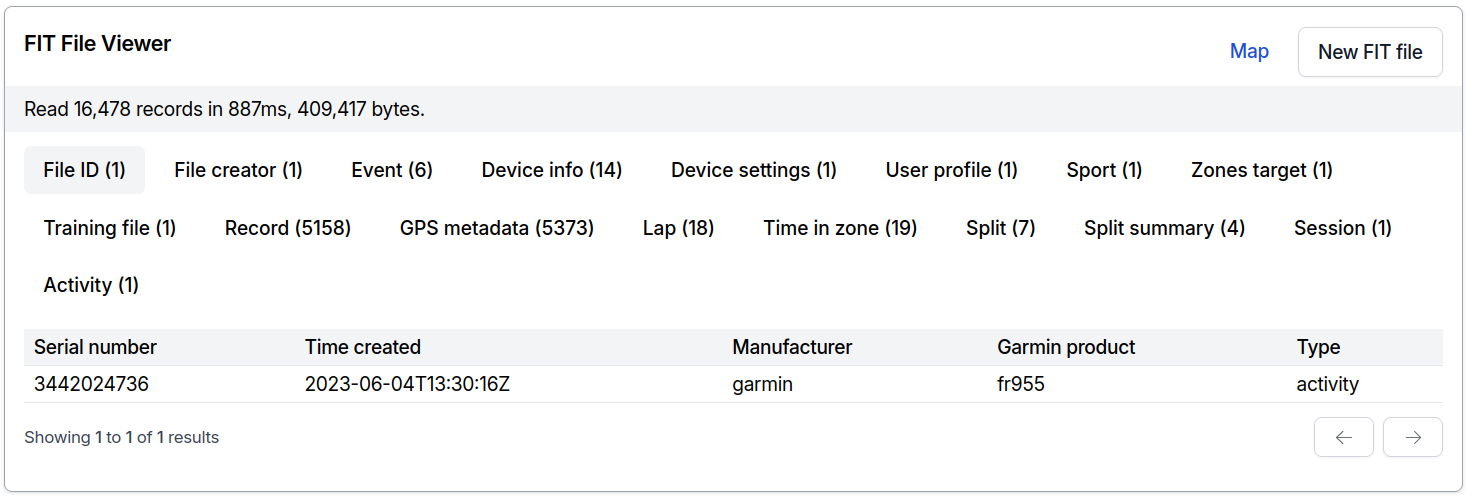
Notice how at the top, there’s a small line with how many records there are in the file, how large it is and how long it took to parse it (very long!). This information is mostly useless to the person uploading the file but very useful to me! There are some crazy files in the wild, from activities like Kilian’s Jornet running over 39km in 9 hours with 4765m of elevation in Pyrenees.
One of my option was to simply drop some Logging statements here, and there:
iex> Logger.info(%{message: "File parsed", size_bytes: 409_417, duration_ms: 887})
[info] [duration_ms: 887, size_bytes: 409417, message: "File parsed"]
Easy to add, then you can use a number of tools to parse and analyze the logs. Maybe if I planned to have only this view and nothing else, it would be OK… I also wanted to easily collect additional data from other actions later on too, and have some nice out-of-the box UI to work with the data.
Another option would be to add instrumentation using something like AppSignal integration. However, I prefer not having too much third-party vendor-specific code scattered throughout the application, and it wouldn’t be very usable locally without worrying about usage limits/pricing. Sentry has something similar for Ruby but not for Elixir and suffers from the same problem. Actually, providers should offer some cheap dev mode, without worrying about the limits, with few hours max. of data retention!
In 2024, we have better and vendor agnostic solution - OpenTelemetry. It’s already widely adopted in Elixir ecosystem with integrations for Ecto, Oban, Phoenix, and many more libraries. It perfectly fit into the use case I had and worked seamlessly with the rest of the application. To reiterate on those who are not familiar with OpenTelemetry, taken directly from the website and docs:
OpenTelemetry is a collection of APIs, SDKs, and tools. Use it to instrument, generate, collect, and export telemetry data (metrics, logs, and traces) to help you analyze your software’s performance and behavior.
OpenTelemetry is not an observability backend like Jaeger, Prometheus, or other commercial vendors. OpenTelemetry is focused on the generation, collection, management, and export of telemetry. A major goal of OpenTelemetry is that you can easily instrument your applications or systems, no matter their language, infrastructure, or runtime environment.
To make a system observable, it must be instrumented. That is, the code must emit traces, metrics, or logs. The instrumented data must then be sent to an observability backend.
Adding OpenTelemetry, so many libraries!
OpenTelemetry Elixir Getting Started Guide is an excellent resource to kick-off and that is exactly what I did. This already enabled me to see some traces from Phoenix and LiveView endpoints, but I was focused on decoding the FIT files, remember? This meant I needed to do 2 things:
- Emit telemetry spans (start & stop decoding), events (decoding failed!). Right now, from my own app, later move this inside the library handling decoding
- Ensure all my metadata is included in exported traces
OpenTelemetry.Tracer provides friendly API to add spans and events. In my case, it was a matter of changing decode method (additions are highlighted):
  require OpenTelemetry.Tracer, as: Tracer
  def decode_file(%{file: file, id: id}) do
    size = byte_size(file)
    attrs = %{file_id: id, file_size_bytes: size}

    Tracer.with_span "fit-decode", attributes: attrs do
      case ExtFit.Decode.decode(file) do
        {:ok, records} ->
          Tracer.set_attributes(%{records_count: length(records)})

          {:ok,
           %FitFile{
             id: id,
             records: records,
             size_bytes: size
           }}

        {:error, reason, records, _rest} when is_bitstring(reason) ->
          Tracer.set_attributes(%{records_count: length(records)})
          Tracer.set_status(:error, reason)

          {:error, reason}
      end
    end
  end
There’s an open issue about catching exceptions in with_span and reporting them, so I also wrapped it all in try&rescue block, and reporting exception with OpenTelemetry.Span/record_exception/4.
try do
  ...
rescue
  error ->
    Tracer.set_status(:error, "")
    Tracer.record_exception(error)
    reraise error, __STACKTRACE__
end
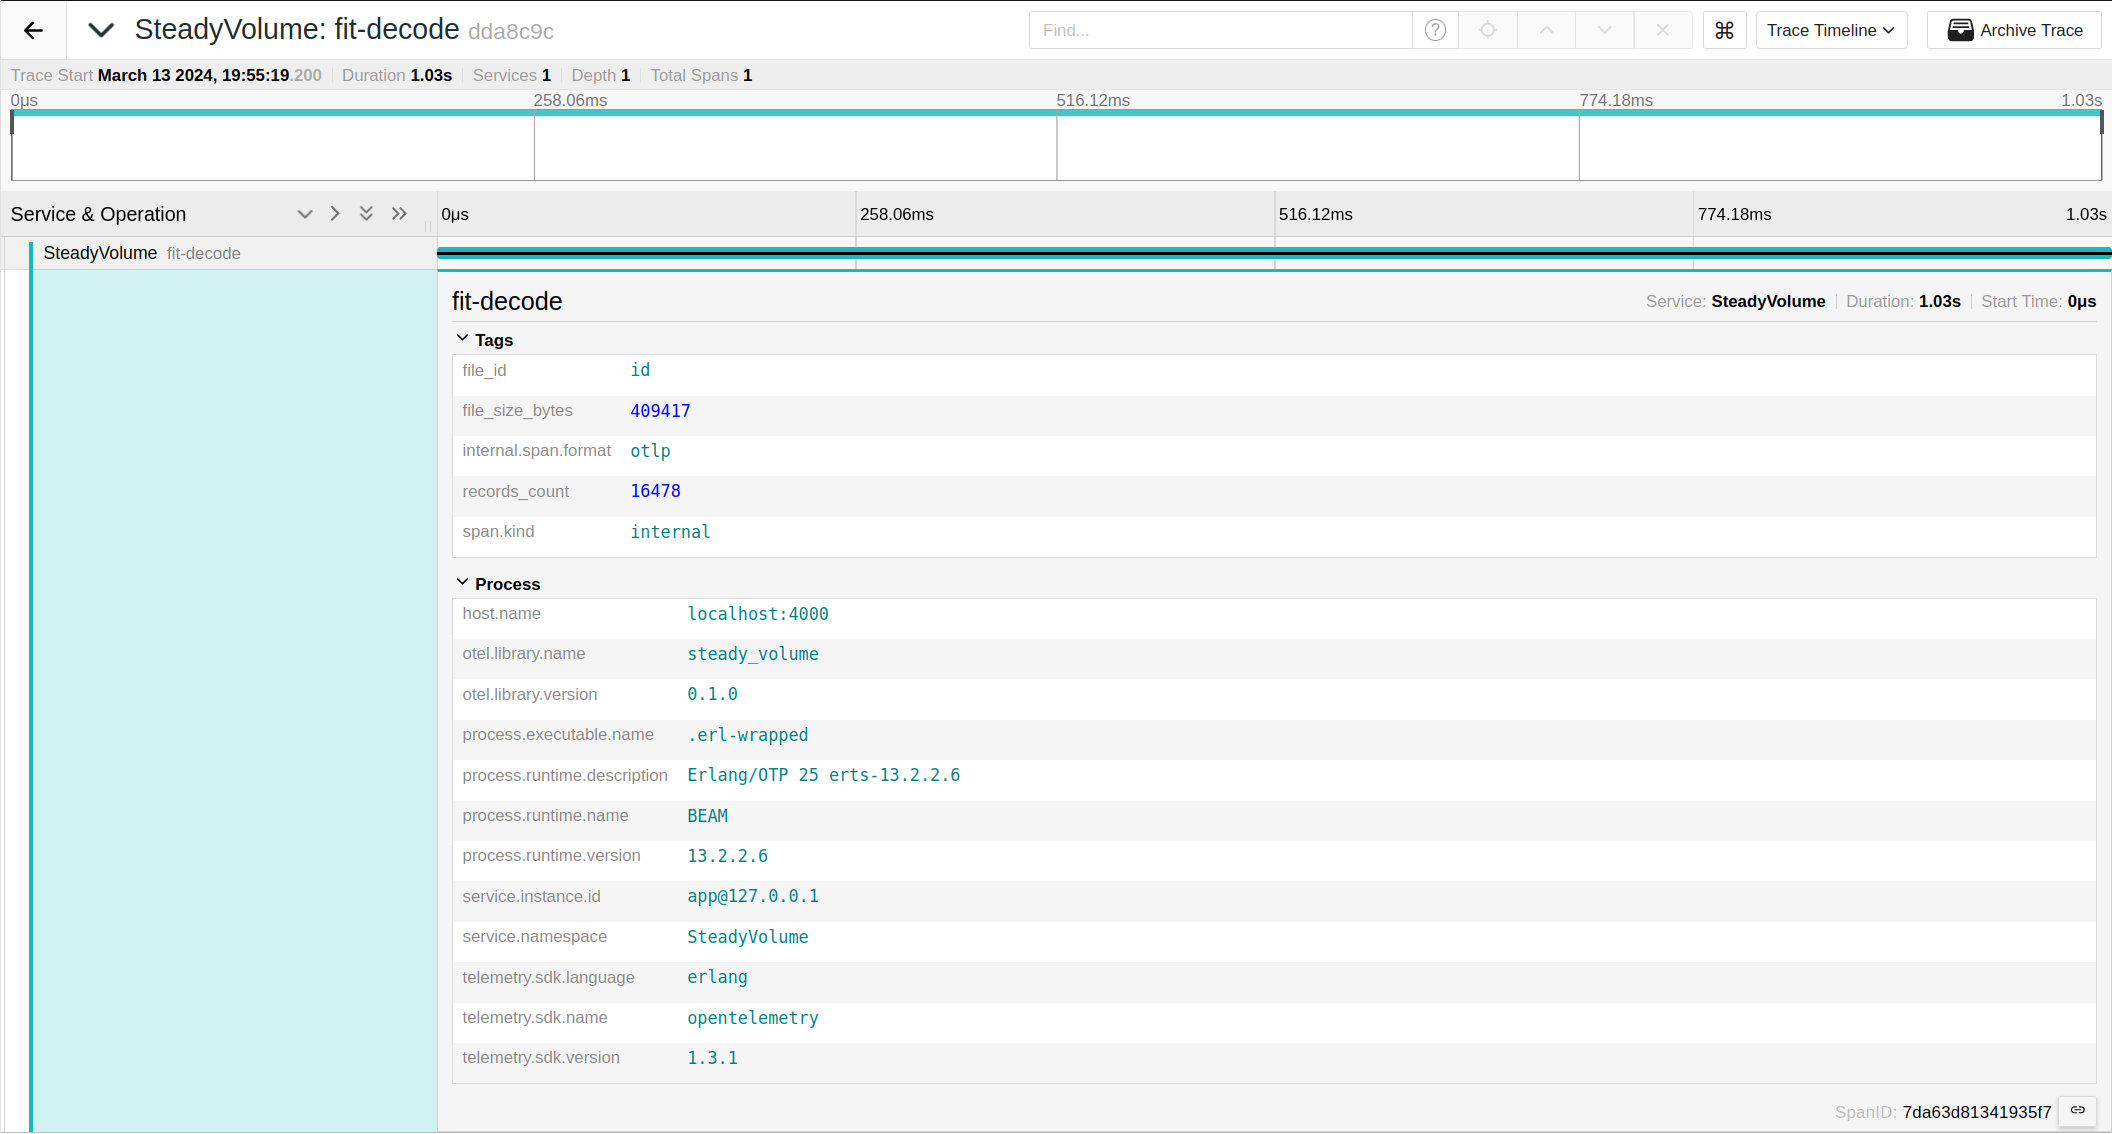
Now when I call decode_file/1 in console, I get a trace exported:
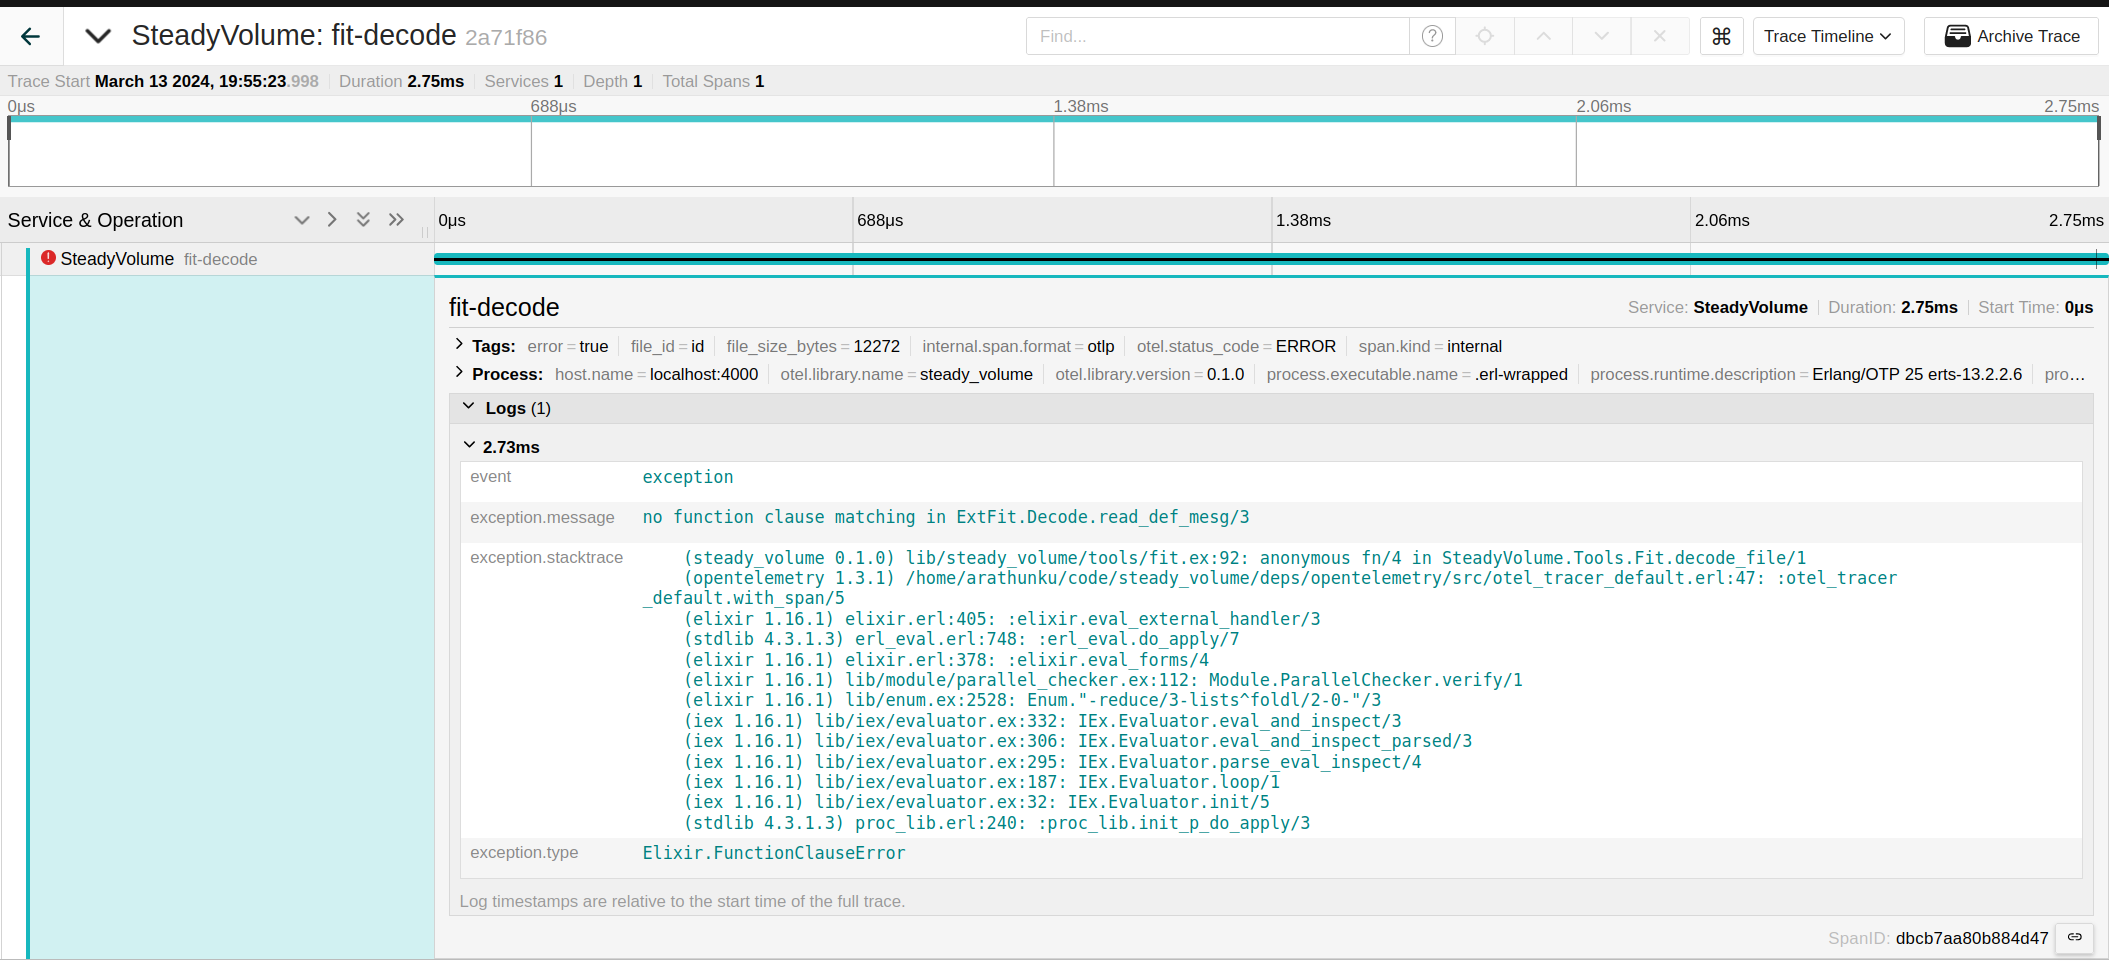
Or when there’s an exception:
And when LiveView is calling decode/1:
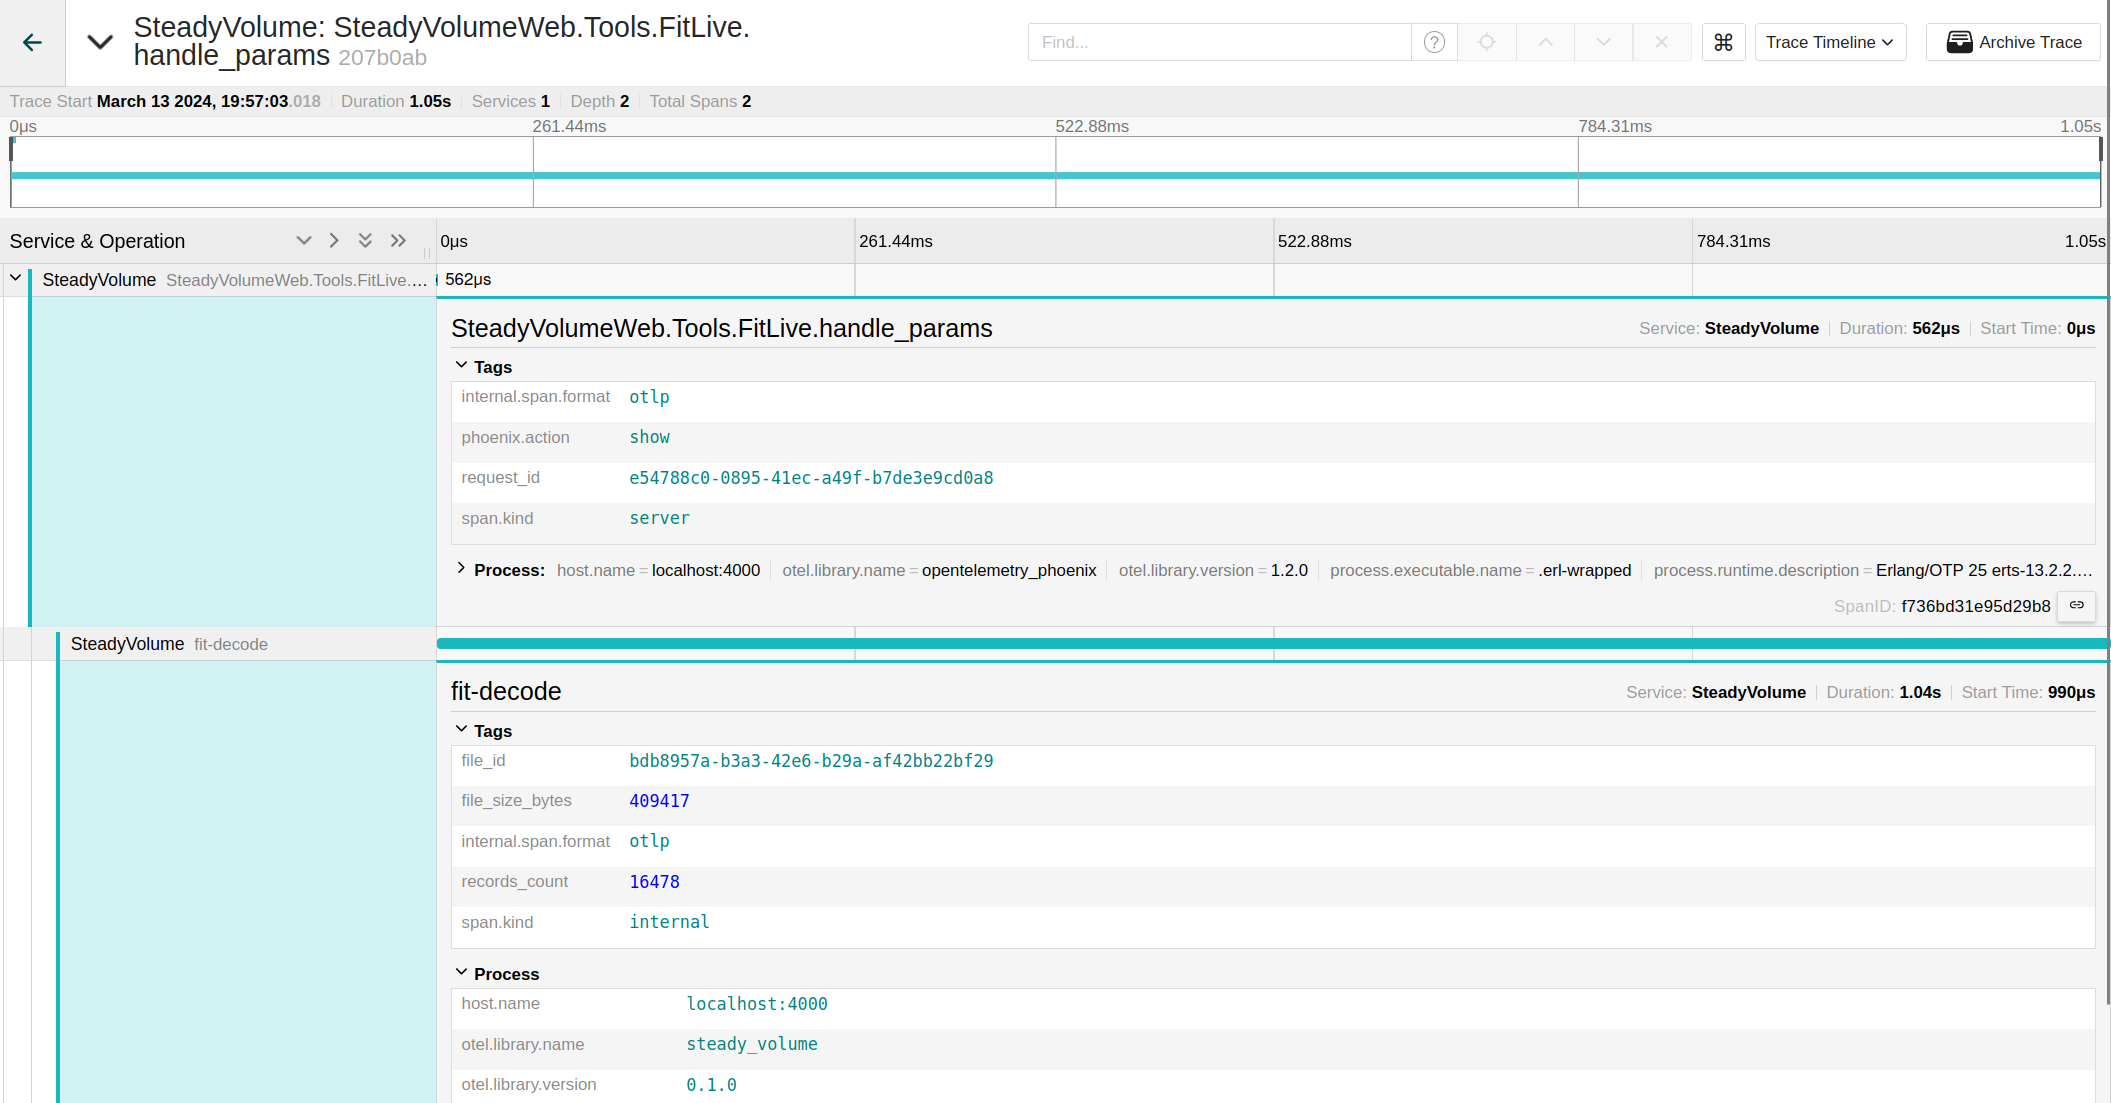
All those screenshots come from Jaeger, running locally in a docker container.
Too many traces!!!
A single page load, without taking any actions, triggered several different traces. Some of them are due to running in dev mode, like repo.query:schema_migrations but other are in many cases, overwhelming noise that I’m not going to care about in my side project. For real production app, with budget larger than $0, it would be good to store most of them,(if your budget permits), but not in my case.
The simplest way to filter out traces, still staying within Elixir and without any additional services is to add a sampler. It starts with updating config.exs and creating a sampler module:
config :opentelemetry,
  sampler: {:parent_based, %{root: {SteadyVolume.Telemetry.Sampler, %{}}}}
My sampler is extremely simple, it implements @behaviour :otel_sampler and drops few, very specific, traces.
defmodule SteadyVolume.Telemetry.Sampler do
  require OpenTelemetry.Tracer, as: Tracer
  require Logger

  @behaviour :otel_sampler

  # dev/static routes, I don't care about that at this moment
  @ignored_get_paths ~r/^\/(assets|fonts|live|phoenix|dev)\/.*/

  @impl :otel_sampler
  def setup(_sampler_opts), do: []

  @impl :otel_sampler
  def description(_sampler_config), do: "SteadyVolume.Sampler"

  @impl :otel_sampler
  def should_sample(
        ctx,
        _trace_id,
        _links,
        span_name,
        span_kind,
        attributes,
        _sampler_config
      ) do
    result = drop_trace?(span_name, attributes)
    Logger.debug(fn ->
      "TRACE drop=#{result} span_names=#{span_name} kind=#{span_kind}"
    end)

    tracestate = Tracer.current_span_ctx(ctx) |> OpenTelemetry.Span.tracestate()

    case result do
      true ->
        {:drop, [], tracestate}

      false ->
        {:record_and_sample, [], tracestate}
    end
  end

  def drop_trace?(span_name, attributes) do
    cond do
      # I don't care about WS connection
      span_name == "Websocket" -> true
      # dev only but filter out to reduce noise
      span_name == "steady_volume.repo.query:schema_migrations" -> true

      span_name == "HTTP GET" && (attributes[:"http.target"] || "") =~ @ignored_get_routes -> true
      true -> false
    end
  end
end
Yes,
cond do ... endcould be also a big condition with()and&&, but I findcondmore readable and formats automatically more neatly (IMO!).
Screenshot of a log on a initial page load with the sampler, without dropping anything:
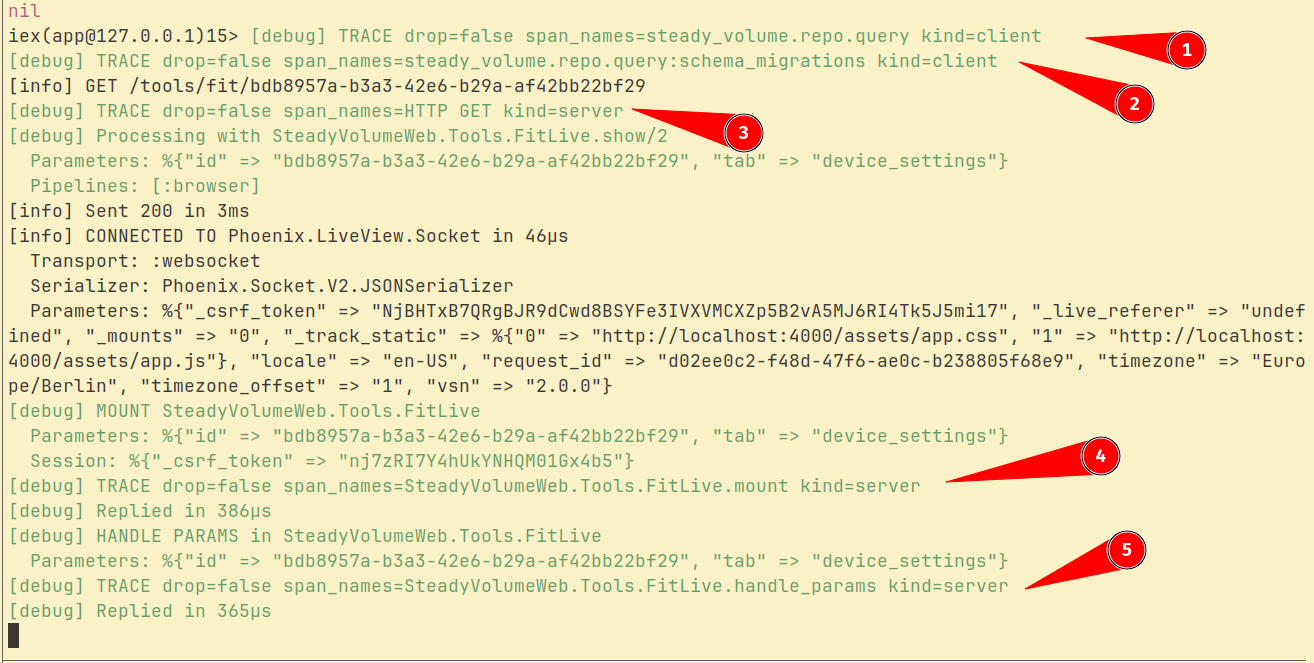
Dropped traces will also go a long way in maximizing usefulness of those free plans! I’m using honeycomb.io, with 20 milion events for free.
Another way to do filtering(and many other things) is OTEL Collector, where similar filter in YAML config looks like this:
processors:
  filter/ottl:
    error_mode: ignore
    traces:
      span:
        - 'IsMatch(attributes["http.target"], "/(assets|fonts|live|phoenix)/.*") == true'
        - 'name == "Websocket"'
        - 'name == "steady_volume.repo.query:schema_migrations"'
I’ll most likely use OTEL Collector at some point because there are some additional useful features like storing all traces in log files and pushing metric to Prometheus. For now, I keep the stack very simple, it will have to wait. Elixir sampler gets the job done and I don’t have to worry about yet another app to run and maintain.
Specs are great!
Due to OpenTelemetry standardization across different tools and libraries, it means that other services and providers can use known naming and conventions to provide insights into collected traces. Without me having to configure anything, Honeycomb can immediately count errors and show p95 latency on HTTP requests.
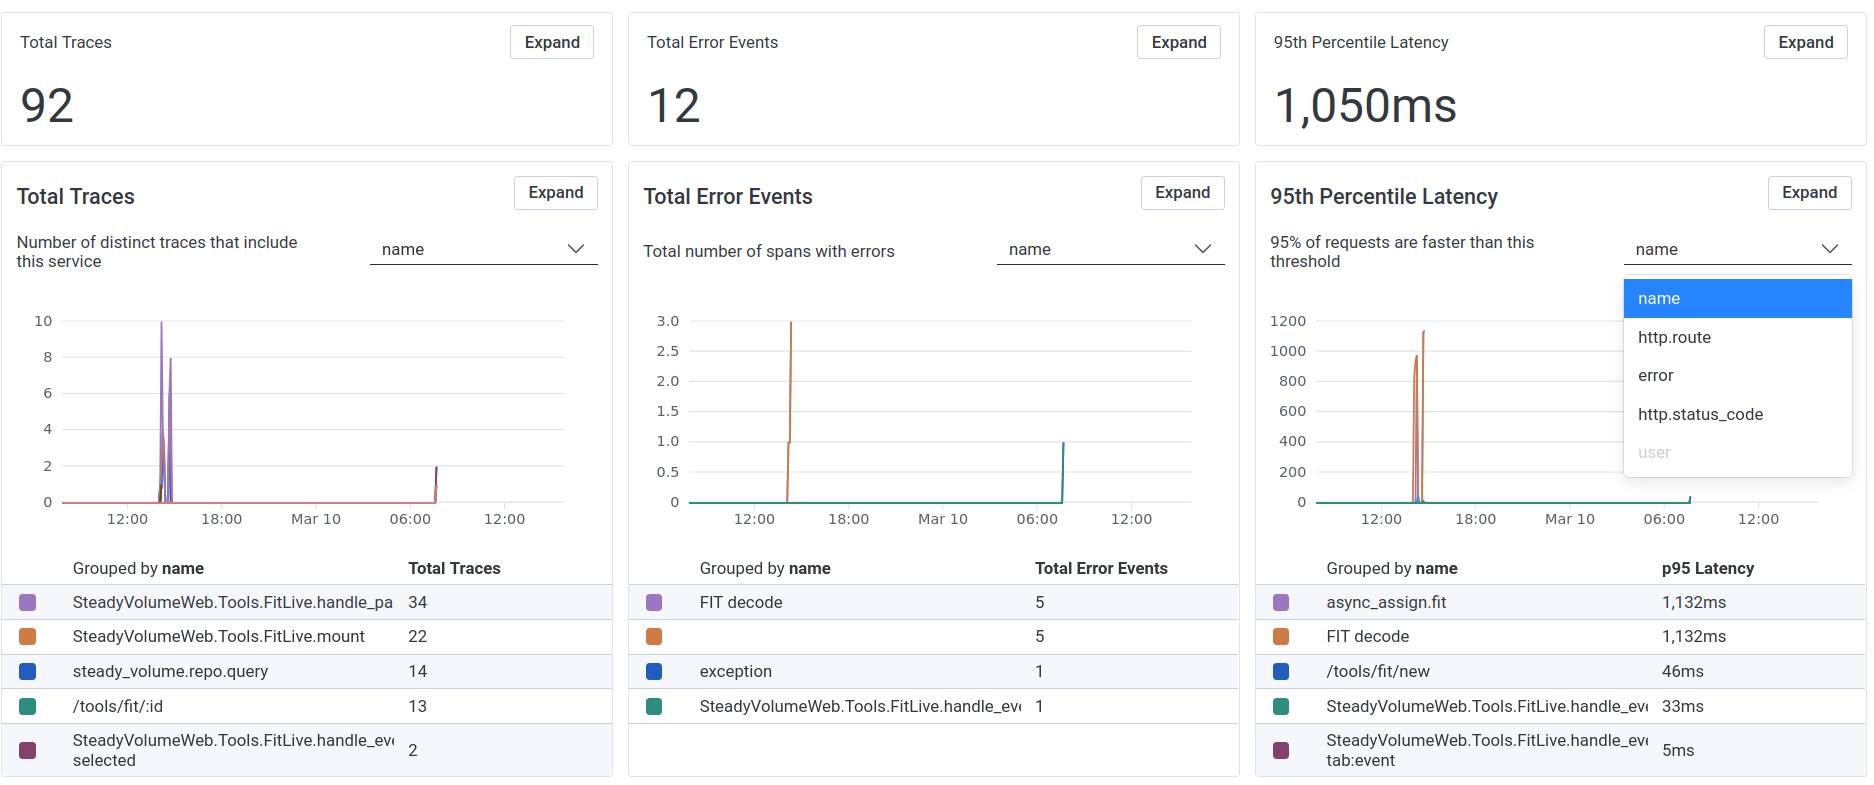 (dev data)
Specification is not only for very common and simple tags like http.target or http.status_code but even for things like messaging systems (used by Oban), feature flags or very specific like aws.s3. This pretty much covers the majority of use cases and you can still add additional custom tags at any point if needed.